在本章中,我们将详细讨论Dash框架.
Dash是一个用于构建分析Web应用程序的开源Python框架.它是一个功能强大的库,可简化数据驱动应用程序的开发.它对于不熟悉Web开发的Python数据科学家特别有用.用户可以使用短划线在他们的浏览器中创建出色的仪表板.
Dash建立在Plotly.js,React和Flask之上,直接将下拉,滑块和图形等现代UI元素与您的分析结合起来python代码.
Dash应用程序包含一个Flask服务器,它通过HTTP请求使用JSON数据包与前端React组件通信.
Dash应用程序是纯粹用python编写,所以不需要HTML或JavaScript.
Dash Setup
如果您的终端中尚未安装Dash,请安装下面提到的Dash库.由于这些库正在积极开发中,因此经常安装和升级. Python 2和3也受支持.
pip install dash == 0.23.1#核心短划线后端
pip install dash-renderer == 0.13.0#dash前端
pip install dash -html-components == 0.11.0 #HTML components
pip install dash-core-components == 0.26.0 #Supercharged components
pip install plotly == 3.1.0 #Plotly graphing library
为了确保一切正常,在这里,我们创建了一个简单的dashApp.py文件.
Dash或App布局
Dash应用程序由两部分组成.第一部分是应用程序的"布局",它基本上描述了应用程序的外观.第二部分描述了应用程序的交互性.
核心组件
我们可以使用 dash_html_components 构建布局 dash_core_components 库. Dash为应用程序的所有可视组件提供python类.我们还可以使用JavaScript和React.js自定义我们自己的组件.
将dash_core_components导入为dcc
将dash_html_components导入为html
dash_html_components适用于所有HTML标签,其中dash_core_components用于使用React.js构建的交互.
使用上面两个库,让我们编写一个代码,如下所示 :
app = dash.Dash()app.layout = html.Div(children=[ html.H1(children='Hello Dash'), html.Div(children='''Dash Framework: A web application framework for Python.''')
等效的HTML代码看起来像这样 : 去;
<div> <h1> Hello Dash </h1> <div> Dash Framework: A web application framework for Python. </div></div>
编写简单的短划线应用程序
我们将学习如何编写在文件 dashApp.py 中使用上述库的短划线上的简单示例.
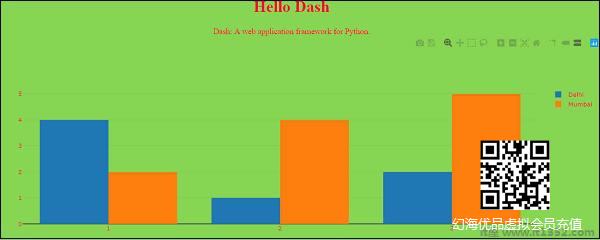
# -*- coding: utf-8 -*-import dashimport dash_core_components as dccimport dash_html_components as htmlapp = dash.Dash()app.layout = html.Div(children=[ html.H1(children='Hello Dash'), html.Div(children='''Dash Framework: A web application framework for Python.'''), dcc.Graph( id='example-graph', figure={ 'data': [ {'x': [1, 2, 3], 'y': [4, 1, 2], 'type': 'bar', 'name': 'Delhi'}, {'x': [1, 2, 3], 'y': [2, 4, 5], 'type': 'bar', 'name': u'Mumbai'}, ], 'layout': { 'title': 'Dash Data Visualization' } } )])if __name__ == '__main__': app.run_server(debug=True)运行Dash应用程序
运行Dash应用程序时请注意以下几点.
(MyDjangoEnv)C:\ Users \ rajesh \Desktop \ MyDjango \dash> python dashApp1.py
提供Flask应用程序"dashApp1"(延迟加载)
环境:生产
警告:不要在生产环境中使用开发服务器.
请改用生产WSGI服务器.
调试模式:开启
使用stat重新启动
调试器处于活动状态!
调试器密码:130-303-947
在上运行http://127.0.0.1:8050/(按CTRL + C退出)
127.0.0.1 - - [12/Aug/2018 09:32:39]"GET/HTTP/1.1"200 - 127.0.0.1 - - [12/Aug/2018 09:32: 42]"GET/_dash-layout HTTP/1.1"200 - 127.0.0.1 - - [12/Aug/2018 09:32:4 2]"GET/_dash-dependencies HTTP/1.1"200 - 127.0.0.1 - - [12/Aug/2018 09:32:42]"GET/favicon.ico HTTP/1.1"200 - 127.0.0.1 - - [12/Aug/2018 09:39:52]"GET/favicon.ico HTTP/1.1"200 -
访问 http:127.0.0.1:8050/在您的网络浏览器中.您应该会看到一个看起来像这样的应用.
在上面的程序中,要注意的几个要点如下:
应用程序布局由一棵树组成"组件",如html.Div和dcc.Graph.
dash_html_components库包含每个HTML标记的组件. html.H1(children ='Hello Dash')组件生成< h1> Hello Dash</h1>应用程序中的HTML元素.
并非所有组件都是纯HTML. dash_core_components描述了更高级别的组件,这些组件是交互式的,并通过React.js库使用JavaScript,HTML和CSS生成.
每个组件都完全描述通过关键字属性. Dash是声明性的:您将主要通过这些属���描述您的应用程序.
children属性是特殊的.按照惯例,它总是第一个属性,这意味着你可以省略它.
Html.H1(children ='Hello Dash')与html相同.H1('Hello Dash').
应用程序中的字体与此处显示的字体略有不同.此应用程序使用自定义CSS样式表来修改元素的默认样式.自定义字体样式是允许的,但截至目前,我们可以添加以下网址或您选择的任何网址 :
app.css.append_css({"external_url": https://codepen.io/chriddyp/pen/bwLwgP.css })让您的文件获得与这些示例相同的外观.
关于HTML的更多信息
dash_html_components库包含每个HTML标记的组件类以及所有HTML参数的关键字参数.
让我们在之前的应用文本中添加组件的内联样式 :
# -*- coding: utf-8 -*-import dashimport dash_core_components as dccimport dash_html_components as htmlapp = dash.Dash()colors = { 'background': '#87D653', 'text': '#ff0033'}app.layout = html.Div(style={'backgroundColor': colors['background']}, children=[ html.H1( children='Hello Dash', style={ 'textAlign': 'center', 'color': colors['text'] } ), html.Div(children='Dash: A web application framework for Python.', style={ 'textAlign': 'center', 'color': colors['text'] }), dcc.Graph( id='example-graph-2', figure={ 'data': [ {'x': [1, 2, 3], 'y': [4, 1, 2], 'type': 'bar', 'name': 'Delhi'}, {'x': [1, 2, 3], 'y': [2, 4, 5], 'type': 'bar', 'name': u'Mumbai'}, ], 'layout': { 'plot_bgcolor': colors['background'], 'paper_bgcolor': colors['background'], 'font': { 'color': colors['text'] } } } )])if __name__ == '__main__': app.run_server(debug=True)在在上面的示例中,我们使用style属性修改了html.Div和html.H1组件的内联样式.

它在Dash应用程序中呈现如下 :

dash_html_components和HTML属性之间存在几个关键区别 :
对于Dash中的样式属性,您可以只提供字典,而在HTML中,它是以分号分隔的字符串.
样式字典键是 camelCased ,因此text-align更改为 textalign .
Dash中的ClassName类似于HTML class属性.
第一个争论者t是通过children关键字参数指定的HTML标记的子项.
可重用组件
通过在Python中编写我们的标记,我们可以创建复杂的可重用组件,例如表,而无需切换上下文或语言 :
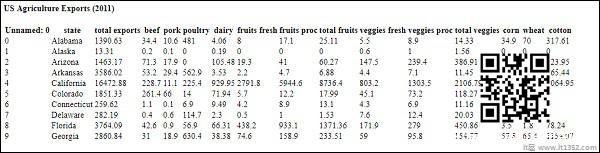
下面是一个从pandas数据框生成"表"的快速示例.
import dashimport dash_core_components as dccimport dash_html_components as htmlimport pandas as pddf = pd.read_csv( 'https://gist.githubusercontent.com/chriddyp/' 'c78bf172206ce24f77d6363a2d754b59/raw/' 'c353e8ef842413cae56ae3920b8fd78468aa4cb2/' 'usa-agricultural-exports-2011.csv')def generate_table(dataframe, max_rows=10): return html.Table( # Header [html.Tr([html.Th(col) for col in dataframe.columns])] + # Body [html.Tr([ html.Td(dataframe.iloc[i][col]) for col in dataframe.columns ]) for i in range(min(len(dataframe), max_rows))] )app = dash.Dash()app.layout = html.Div(children=[ html.H4(children='US Agriculture Exports (2011)'), generate_table(df)])if __name__ == '__main__': app.run_server(debug=True)
我们的输出类似于 :
有关可视化的更多信息
dash_core_components库包含一个名为 Graph 的组件.
Graph使用开源plotly.js JavaScript图形库呈现交互式数据可视化. Plotly.js支持大约35种图表类型,并在矢量质量SVG和高性能WebGL中呈现图表.
下面是一个从Pandas数据框创建散点图的示例 :
import dashimport dash_core_components as dccimport dash_html_components as htmlimport pandas as pdimport plotly.graph_objs as goapp = dash.Dash()df = pd.read_csv( 'https://gist.githubusercontent.com/chriddyp/' + '5d1ea79569ed194d432e56108a04d188/raw/' + 'a9f9e8076b837d541398e999dcbac2b2826a81f8/'+ 'gdp-life-exp-2007.csv')app.layout = html.Div([ dcc.Graph( id='life-exp-vs-gdp', figure={ 'data': [ go.Scatter( x=df[df['continent'] == i]['gdp per capita'], y=df[df['continent'] == i]['life expectancy'], text=df[df['continent'] == i]['country'], mode='markers', opacity=0.7, marker={ 'size': 15, 'line': {'width': 0.5, 'color': 'white'} }, name=i ) for i in df.continent.unique() ], 'layout': go.Layout( xaxis={'type': 'log', 'title': 'GDP Per Capita'}, yaxis={'title': 'Life Expectancy'}, margin={'l': 40, 'b': 40, 't': 10, 'r': 10}, legend={'x': 0, 'y': 1}, hovermode='closest' ) } )])if __name__ == '__main__': app.run_server()上述代码的输出是如下 :

这些图表具有交互性和响应性.您可以将鼠标悬停在点上以查看其值,单击图例项以切换轨迹,单击并拖动以缩放,按住Shift键,然后单击并拖动以平移.
Markdown
虽然dash通过dash_html_components库公开HTML风格,但用HTML编写副本可能会很繁琐.要编写文本块,可以使用dash_core_components库中的Markdown组件.
核心组件
dash_core_components包含一组更高级别的下拉列表,图形,降价,块等组件.
与所有其他Dash组件一样,它们完全以声明方式描述.每个可配置的选项都可以作为组件的关键字参数.
下面是一个示例,使用了一些可用的组件 :
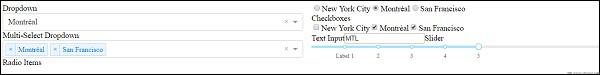
# -*- coding: utf-8 -*-import dashimport dash_core_components as dccimport dash_html_components as htmlapp = dash.Dash()app.layout = html.Div([ html.Label('Dropdown'), dcc.Dropdown( options=[ {'label': 'New York City', 'value': 'NYC'}, {'label': u'Montréal', 'value': 'MTL'}, {'label': 'San Francisco', 'value': 'SF'} ], value='MTL' ), html.Label('Multi-Select Dropdown'), dcc.Dropdown( options=[ {'label': 'New York City', 'value': 'NYC'}, {'label': u'Montréal', 'value': 'MTL'}, {'label': 'San Francisco', 'value': 'SF'} ], value=['MTL', 'SF'], multi=True ), html.Label('Radio Items'), dcc.RadioItems( options=[ {'label': 'New York City', 'value': 'NYC'}, {'label': u'Montréal', 'value': 'MTL'}, {'label': 'San Francisco', 'value': 'SF'} ], value='MTL' ), html.Label('Checkboxes'), dcc.Checklist( options=[ {'label': 'New York City', 'value': 'NYC'}, {'label': u'Montréal', 'value': 'MTL'}, {'label': 'San Francisco', 'value': 'SF'} ], values=['MTL', 'SF'] ), html.Label('Text Input'), dcc.Input(value='MTL', type='text'), html.Label('Slider'), dcc.Slider( min=0, max=9, marks={i: 'Label {}'.format(i) if i == 1 else str(i) for i in range(1, 6)}, value=5, ),], style={'columnCount': 2})if __name__ == '__main__': app.run_server(debug=True)输出从上面的程序如下 :
呼叫帮助
Dash组件是声明性的.这些组件的每个可配置方面都在安装期间设置为关键字参数.您可以在任何组件的python控制台中调用help来了解有关组件及其可用参数的更多信息.其中一些是在下面和下面给出的;
>>> help(dcc.Dropdown)Help on class Dropdown in module builtins:class Dropdown(dash.development.base_component.Component)| A Dropdown component.| Dropdown is an interactive dropdown element for selecting one or more| items.| The values and labels of the dropdown items are specified in the `options`| property and the selected item(s) are specified with the `value` property.|| Use a dropdown when you have many options (more than 5) or when you are| constrained for space. Otherwise, you can use RadioItems or a Checklist,| which have the benefit of showing the users all of the items at once.|| Keyword arguments:| - id (string; optional)| - options (list; optional): An array of options| - value (string | list; optional): The value of the input. If `multi` is false (the default)-- More --
总结一下,Dash应用程序的布局描述了应用程序的内容好像.布局是组件的分层树. dash_html_components库为所有HTML标记和关键字参数提供类,并描述样式,className和id等HTML属性. dash_core_components库生成更高级别的组件,如控件和图形.
免责声明:以上内容(如有图片或视频亦包括在内)有转载其他网站资源,如有侵权请联系删除
-
设计总结|如何更好地表达活动品牌?

-

谈谈“目标思维”的落地
编辑导读:我们在做数据分析之前,一定要搞清楚需求方的目标到底是什么,要根据目标来重新定义业务方提出的问题,这就是目标思维。目标思维有多重要呢?应该如何落地呢...
-
在线教育平台竞品分析:网易云课堂vs腾讯课堂
本文从移动端出发,对当前比较热门的两款在线教育平台软件-网易云课堂和腾讯课堂进行比较和分析,不足之处还请大家多提意见。 市场分析 随着国内互联网技术的发展和移...
-
即学即用|父亲节活动的4种运营策略


-
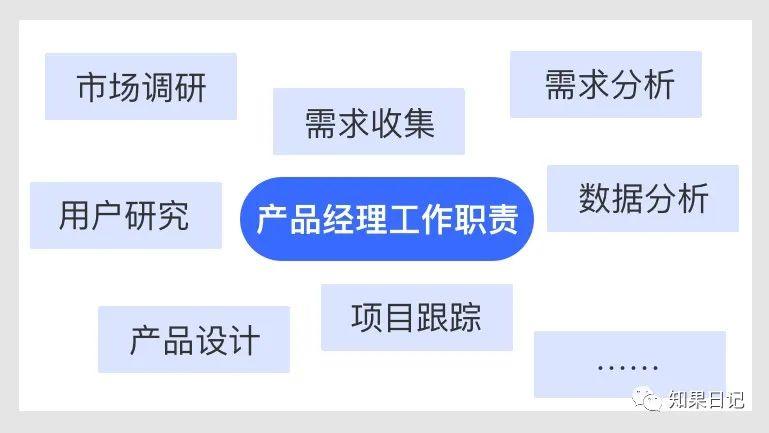
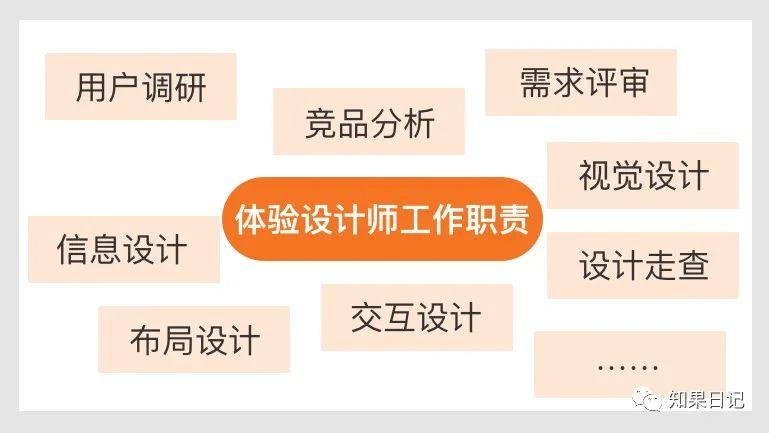
B端产品经理和体验设计师的工作职责边界梳理

-
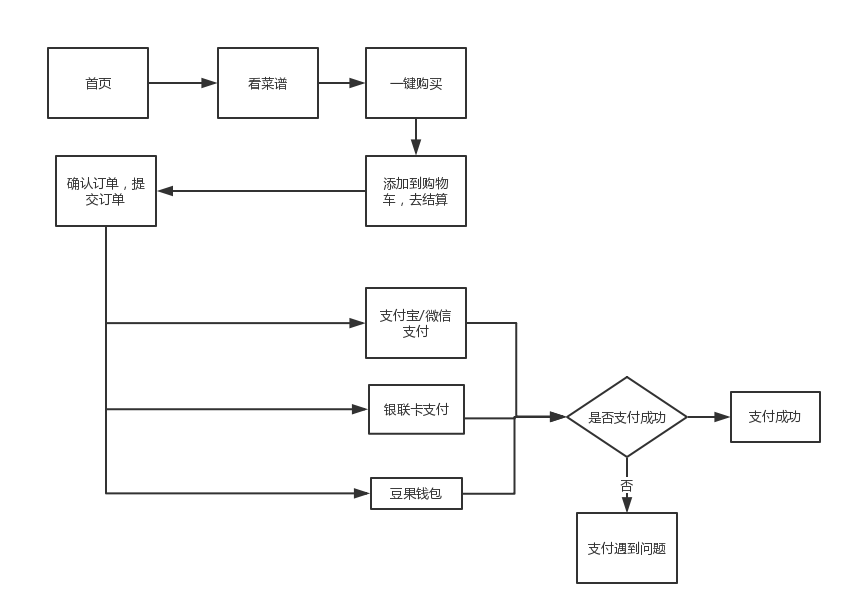
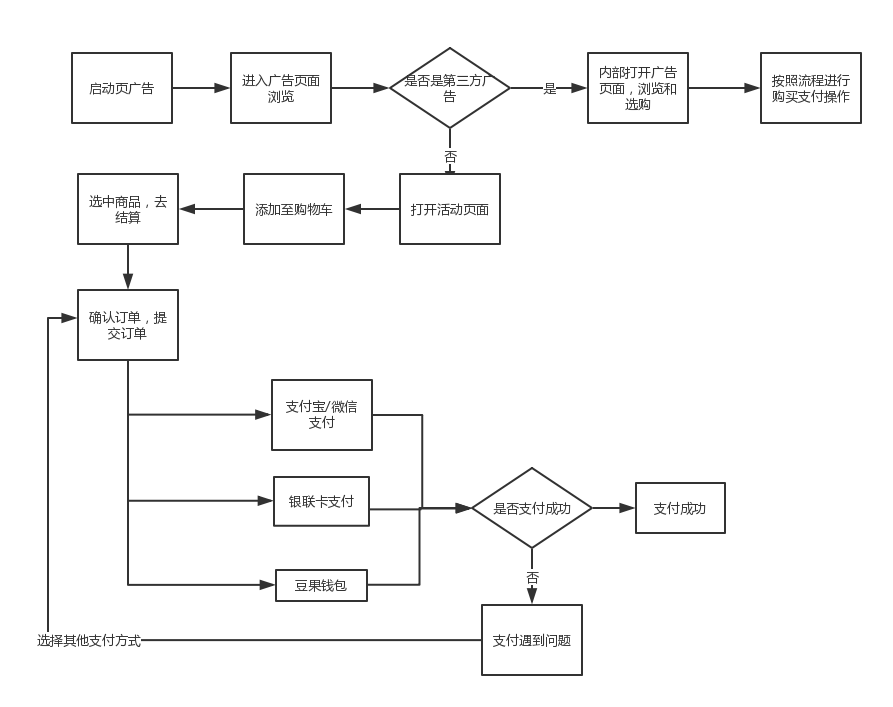
豆果美食电商分支用户体验报告及建议

-

数据分析师如何提高工作效率
在我们的日常工作中,提高工作效率是每个岗位都需要实现的,在工作中,面对比较凌乱的事情时,首先我们需要梳理清楚,按重要级进行开展;本文作者分享了关于...
-
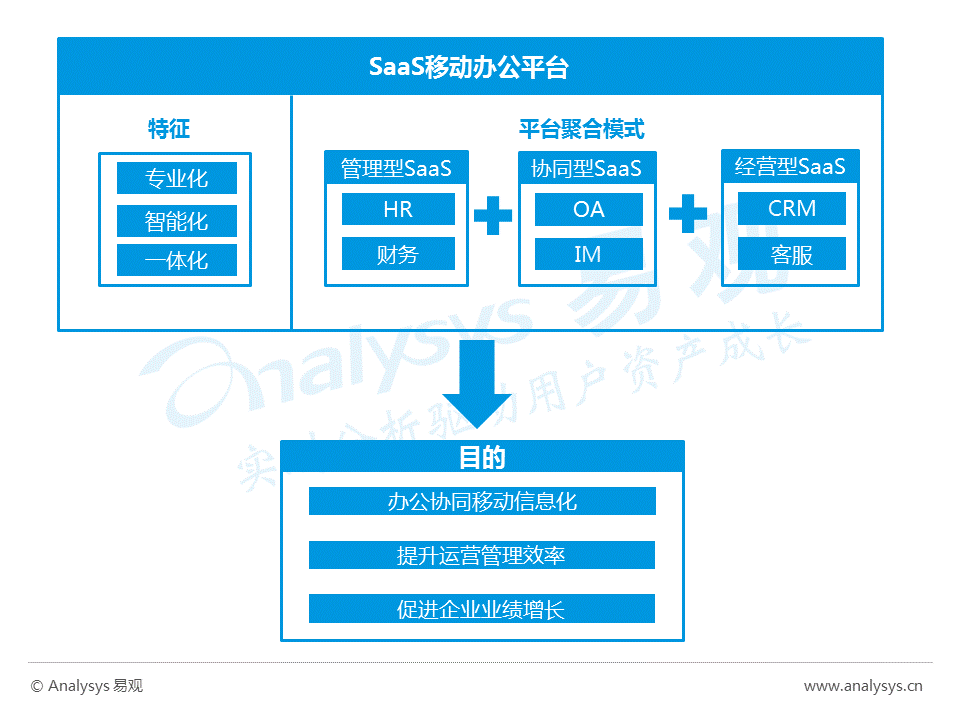
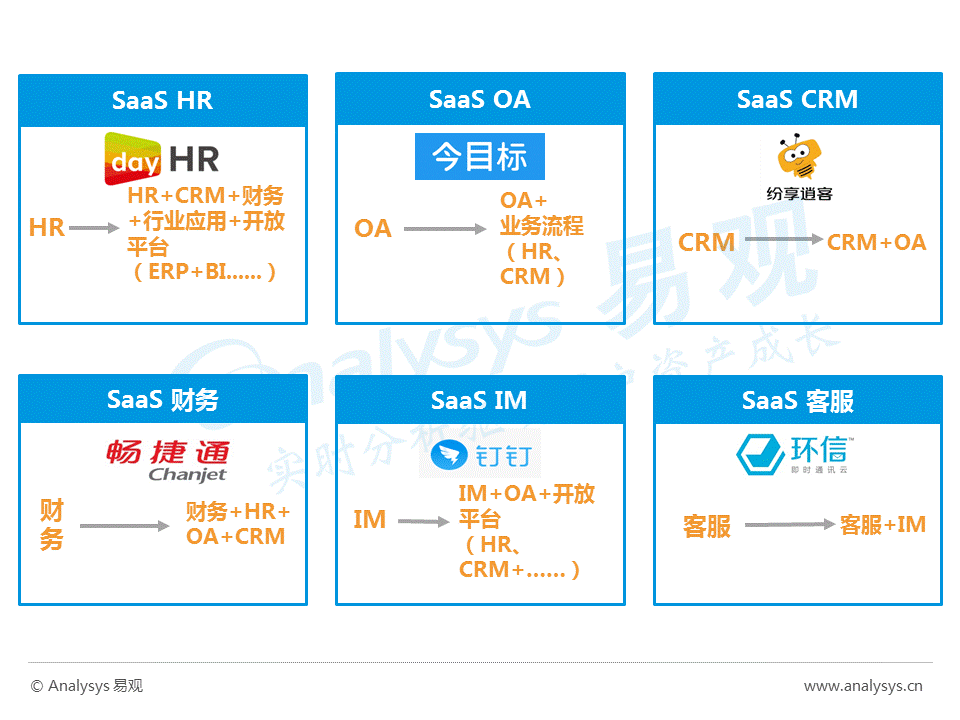
2016中国云计算SaaS移动办公平台年度综合报告

-
网易大布局教育事业:网易公开课、网易云课堂和MOOC分析

-
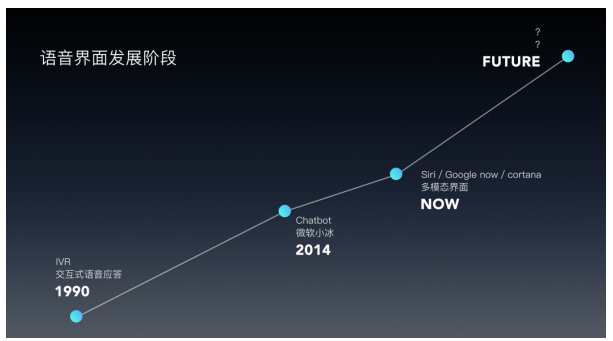
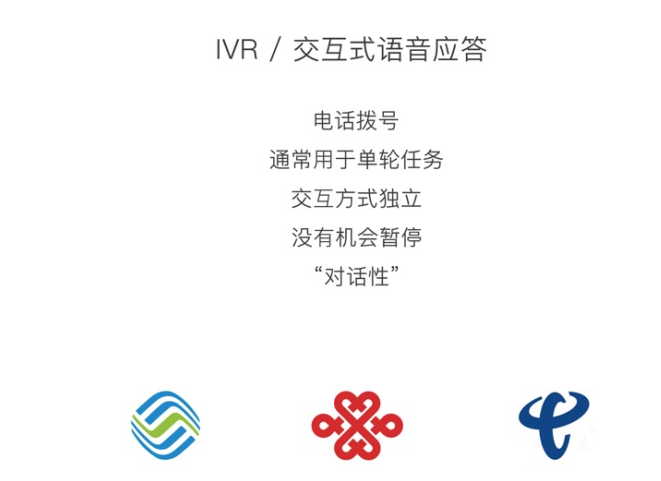
一篇文章搞懂语音交互的来龙去脉